Decide once, for the month ahead.
Demand plans with a forecast scorecard, buffer levels that size the stock you should hold, a buying plan and a build plan, scenarios to test a decision, and a monthly meeting the plan is signed off in.
Demand planning above MRP, where the decisions are actually made
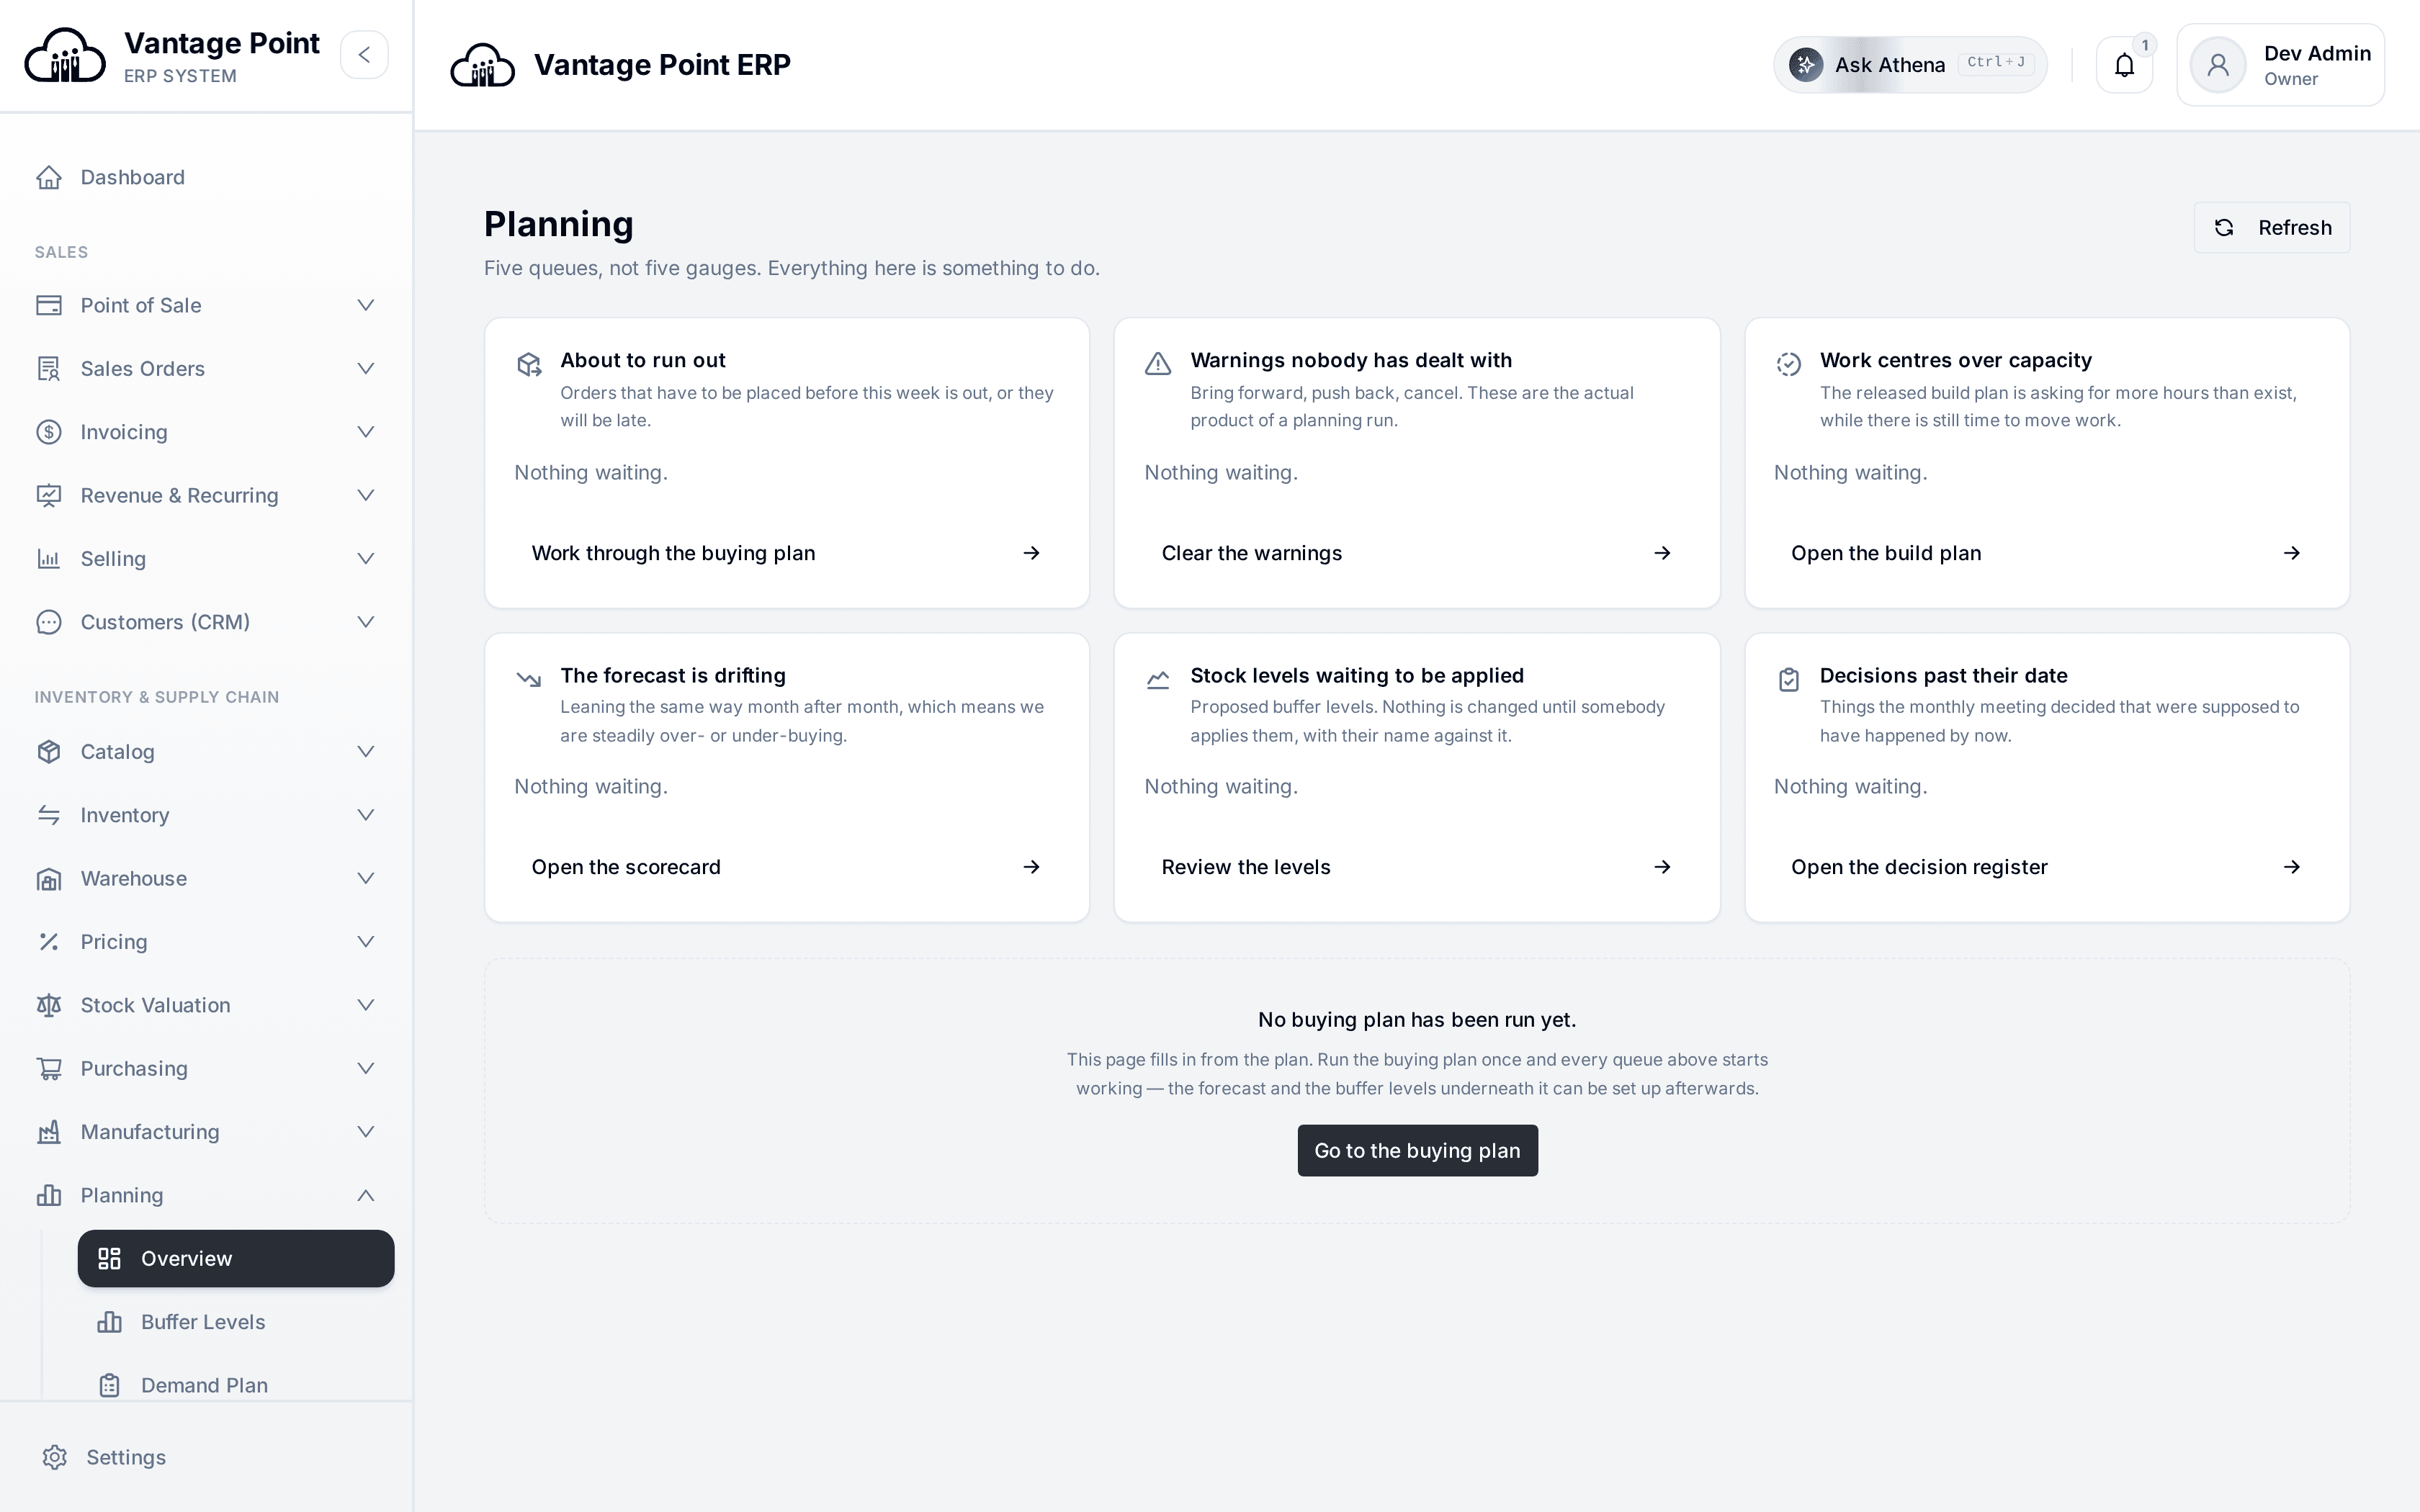
Material requirements planning is arithmetic: once everybody agrees what demand will be, working out what to order and when is mechanical. The hard part happens before that, in the argument about what demand will be — and that argument is usually held in three private spreadsheets belonging to sales, buying and the factory. Vantage Point's planning module puts it in one place, as a demand plan by product and branch that all three work from.
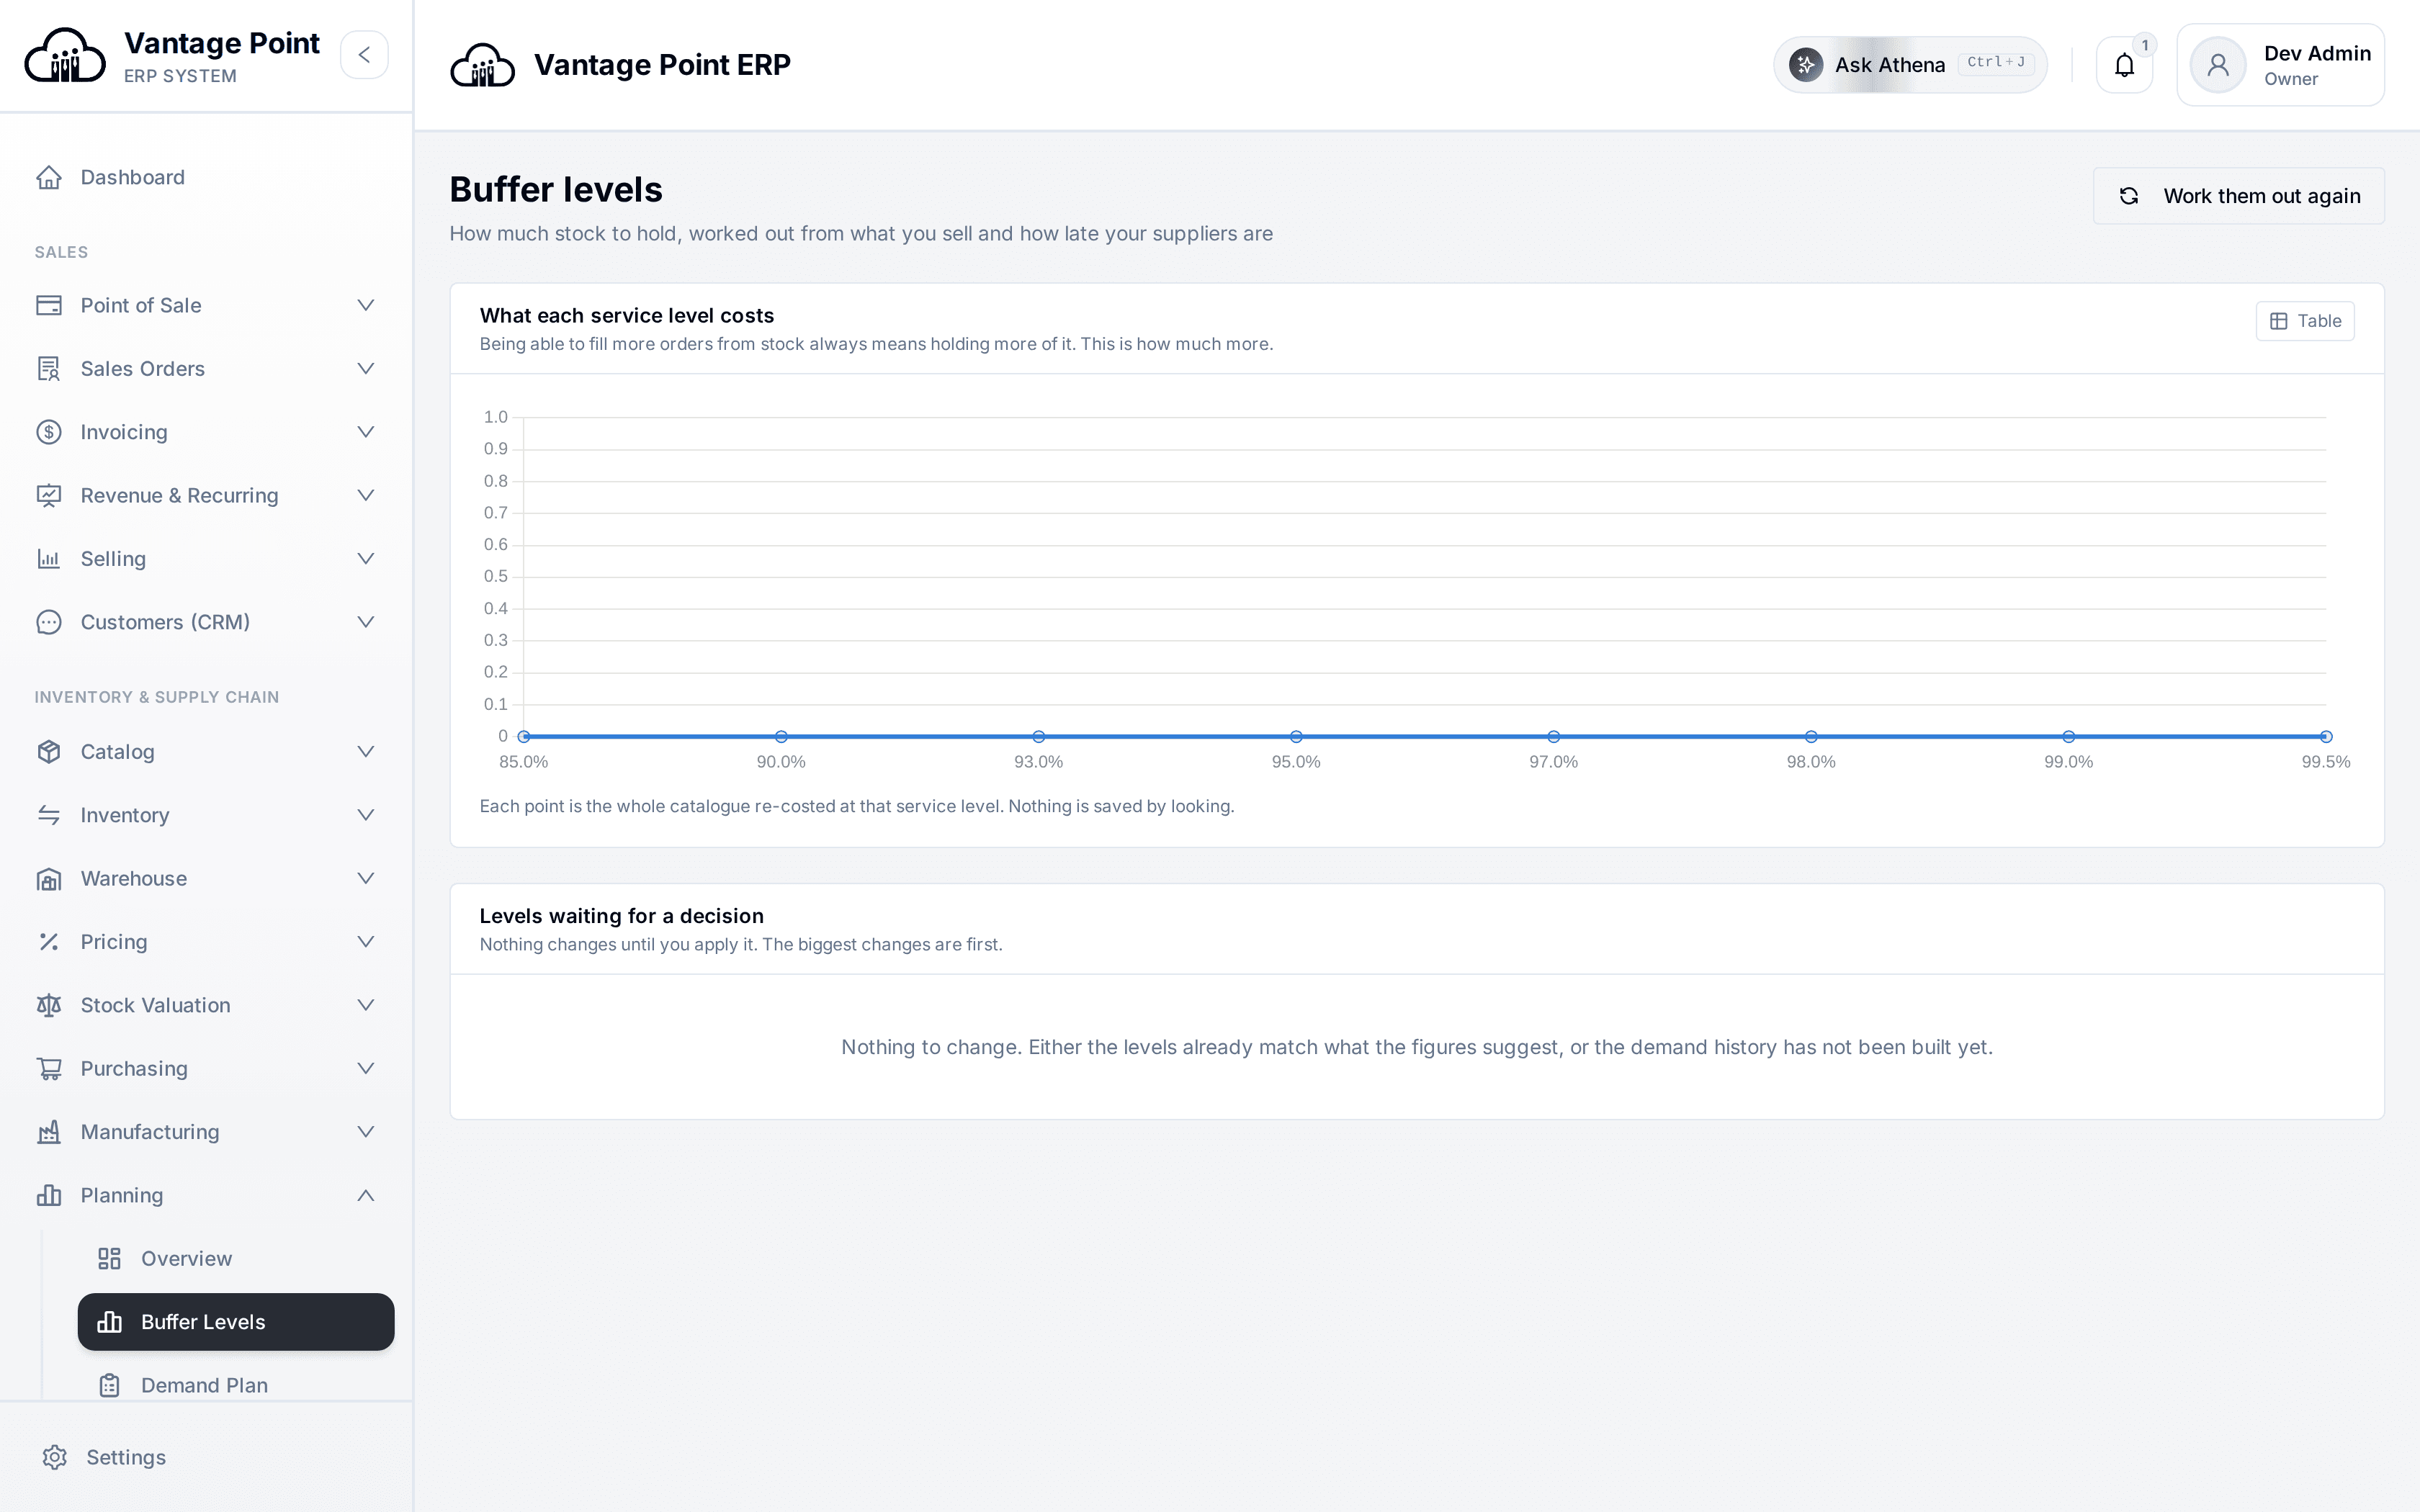
It also keeps score. The forecast scorecard reports forecast value added: whether each human adjustment to the statistical forecast actually made it better, per planner and per period. That is an uncomfortable number and a useful one, because a business that cannot tell whether its forecasting is any good cannot improve it. Buffer levels are sized from demand variability and lead time rather than from a figure typed in years ago and never revisited.
From the agreed plan, the buying plan says what to order and when given what is already on order and on the shelf, and the build plan and factory timetable lay out what the factory will make against the capacity it actually has. Scenarios let you test a decision — a large order, a lost supplier, a price move — before committing to it, and the monthly meeting screen records what was agreed, so the plan has a history rather than just a current state.
Above MRP, where the arguing happens.
MRP works out what to order once everybody agrees on the demand. This is the part before that — agreeing on the demand, and being able to show later whether the forecast was any good.
Planning & Forecasting, asked and answered.
How is this different from MRP?
MRP works out what to buy and make once demand is agreed. This module is the layer above it: agreeing the demand in the first place, holding the plan everybody works from, sizing the stock buffers, and measuring afterwards whether the forecast was any good. MRP itself runs inside the manufacturing module and takes its demand from here.
What is forecast value added?
It is a measure of whether human adjustments to a statistical forecast improved it. Vantage Point keeps both the original statistical forecast and each adjustment, then compares them with what actually happened, reported per planner and per period. Adjustments that consistently make the forecast worse are worth knowing about.
Can I test a decision before making it?
Yes. The scenarios screen lets you model a change — a large order landing, a supplier being lost, a price moving — against the current plan and see what it does to buying, capacity and stock, without touching the plan everybody is working from.
Does it help decide how much stock to hold?
Yes. Buffer levels are calculated per line from demand variability and supplier lead time, so cover is sized to the risk each product actually carries rather than to one blanket rule for the whole catalogue.
The rest of the system.
ONE LEDGER UNDERNEATH IT ALLTake the high ground.
Set up your first store, till and ledger in an afternoon.